
Ce Ma and Farhang Shadman, University of Arizona Sematech Center
Jacques Mettes, MEECO, and Lance Silverman
As semiconductor devices become smaller and more complex, the industry is driven to control and monitor the contaminants in process gases at extremely low levels. Reducing the levels of moisture, oxygen, and particulates can improve device quality and yields, which is increasingly important for manufacturers of costly high-density ICs.1 While as recently as three years ago gas suppliers typically guaranteed moisture in bulk gases at <100 ppb, today 10-ppb specifications are common, with levels below 1 ppb required for some applications. However, because of its strong tendency to adsorb on sampling system surfaces, controlling and measuring moisture at these levels proves especially challenging. Trace-moisture measurements can be performed with hygrometers that are based on capacitive, piezoelectric, chilled-mirror, or coulometric (electrolytic) sensors.2 Because they are relative techniques, capacitive and piezoelectric sensors are of limited value at low-ppb levels, where calibration using "zero" and span gases is problematic.3 In contrast, the coulometric method is an absolute technique that relies solely on physical principles and does not require calibration against moisture standards. In coulometric measurement, a sensor quantitatively absorbs and electrolyzes moisture from a controlled flow of sample gas.4 The sample moisture is absorbed by a thin phosphoric anhydride (P2O5) film that coats the inner walls of a tubular element containing embedded electrodes. The resulting electrolysis current is a measure of the sample's moisture content based on Faraday's Law. Recent advances in this technology, which have been incorporated in a rack-mount instrument, allow reliable moisture determination in the 1-10-ppb range, an order of magnitude improvement in the sensitivity of the method.5 The controlled addition of moisture to the sample gas, combined with sample flow variations and signal integration, permit moisture determination below the normal background signal of the sensor. In addition, the elimination of polymeric materials from the sample flow path minimizes undesirable outgassing effects. The study reported here characterized the accuracy, sensitivity, and response time of the improved instrument using an atmospheric pressure ionization mass spectrometer (APIMS) as an independent measure of generated moisture levels. This mass-spectrometric technique selectively ionizes and detects water and other impurities in gases down to levels below 1 ppb. Although the APIMS is an important tool for measuring trace impurities, its size, complexity, and expense make it primarily a laboratory instrument.
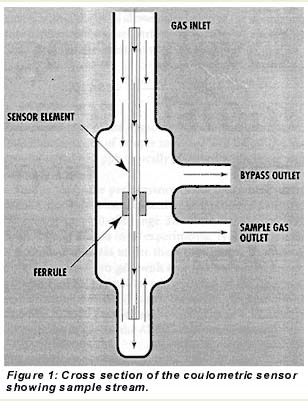
| In contrast to earlier designs that used nonmetallic materials in the sample stream, the new coulometric hygrometer’s sample flow path consists of high-quality, electropolished stainless-steel tubing with orbital welds and VCR connections. The glass sensor element is held in place by a Teflon ferrule in a compression fitting. As shown in Figure 1, the ferrule is located downstream of the point where the sample gas enters the sensor element. Gas flow through a bypass outlet prevents absorption or desorption of moisture by the ferrule from affecting this sample. That is, if moisture were to desorb from the ferrule, it would not diffuse counter to this flow and reach the entrance to the sensing element. Similarly, gas flow from the sensor element outlet prevents moisture desorbed from the ferrule from back-diffusing into the element. Mass-flow controllers to regulate sample and bypass flows are located downstream of the sensor to eliminate their effects on moisture. |
|
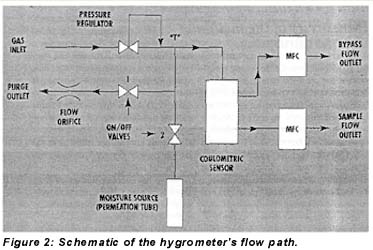
The hygrometer design includes a permeation tube and flow switch that allow the addition of specified amounts of moisture to the sample gas under microprocessor control. The two-valve moisture addition feature is shown in Figure 2. With valve 1 closed and valve 2 open, water vapor diffuses from the permeation tube into the sample stream. When valve 1 is open, however, a small flow of gas vents through an orifice and prevents moisture addition. (Valve 2 is needed for shipping and power-outage conditions; it is always open when the instrument is powered.)
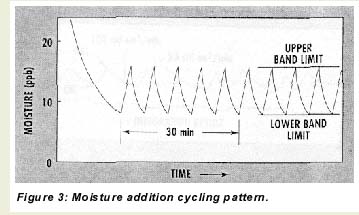
During operation with dry gases, the microprocessor toggles the moisture addition feature off and on so that the sensor continuously cycles between two moisture levels–an upper and lower band limit (UBL and LBL)–as depicted in Figure 3. There are three reasons for this cycling. First, it serves as a constant check on sensor responsiveness for long-term, on-line applications with very dry gases. Second, it keeps the sensor element and other internal parts wetted, which improves response time to intrusions of moisture and prevents damage to the sensor. Third, when combined with systematic flow variations through the sensor and signal integration, the moisture addition cycling allows the microprocessor to calculate sample moisture levels as low as the 0-10-ppb range.
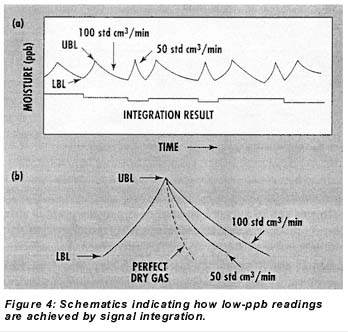
Figures 4a and 4b illustrate the signal integration routine schematically. While the sensor is cycled between the UBL and LBL moisture levels by controlled additions from the permeation tube, the sample flow rate through the sensor element alternates between 50 and 100 std cm3/min during the drydown phases of the cycles. Because the only moisture reaching the element during these phases is from the sample, the drydown time on alternate cycles is perturbed in proportion to the sample’s moisture concentration. In other words, if the sample is perfectly dry, the sensor will dry equally fast at flows of 50 and 100 std CM3/min during drydown, but the higher the moisture concentration of the sample gas, the longer drying time at the 100-std-cm3/min flow will be relative to that at the 50-std-cm3/min flow. Quantitatively, the difference between the integrated areas under the 100- and 50-std-cm3/min drydown curves within the band allows calculation of the sample moisture concentration based strictly on Faraday’s Law. A simplified version of the equation used is as follows:
Area × 2 = Moisture Concentration ÷ Drydown Time
Thus, operation of the hygrometer in integration mode allows measurement of sample moisture well below the background signal of 7 ppb typically observed when the sensor is in standard mode.
In this study, the performance of the hygrometer in integration mode was characterized by generation of moisture in nitrogen in the 1-10-ppb range. The instrument was cycled between 25 and 27 ppb in all experiments. Typically cycle time was about 2 minutes under these conditions. Dry nitrogen from a purifier (zero gas) with and without added moisture from an external permeator was analyzed by the hygrometer and a Trace+ APIMS (Fisons, formerly VG, Middlewich, Cheshire, UK) in parallel, as shown in Figure 5. The external permeator was part of the APIMS calibration system.
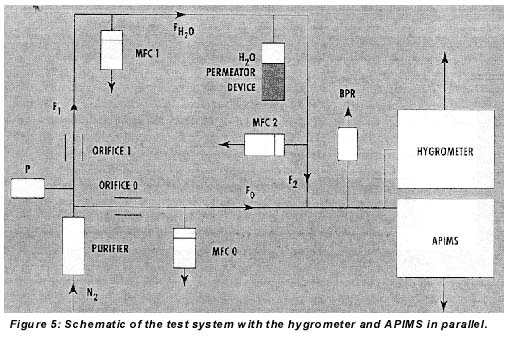
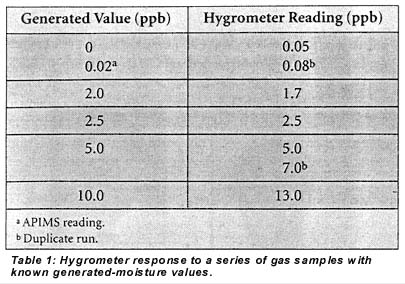
Table 1 shows the response of the hygrometer to a series of samples with varying generated-moisture values ranging from <1 to IO ppb. The instrument's calculated accuracy based on these data is ±4 ppb with a 95% confidence limit and ±5 ppb with a 99% confidence limit. For these runs the calculated moisture values obtained in integration mode were digitally filtered by the instrument to reduce noise. The hygrometer was equilibrated at each moisture level overnight to determine accuracy with the instrument at steady-state.
As seen in the above data, the hygrometer easily distinguishes a 2-ppb added-moisture level from a dry gas. A rigorous calculation of the method detection limit using a variation of the SEMI method for plasma spectroscopy6 yielded 1 ppb with a 95% confidence limit and 2 ppb with a 99% confidence limit. In other words, if there is no water contamination in the sample gas, there is a <1% probability that the instrument would read above 2 ppb.
To limit the potential effects of contaminant intrusions on device yields, a short monitor response time is of critical importance in process control. Two types of measures are significant: the initial response time and the time required to reach a percent of final value. The initial response is the process control engineer’s early warning system–alerting him or her to a potential problem. The percent of final value indicates how serious the intrusion has been. In both cases, it is important that the time lapse be as short as possible.
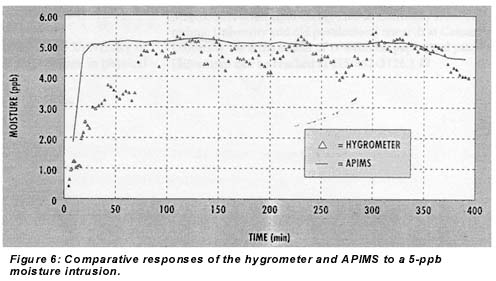
The time response of the coulometric hygrometer in integration mode to a 5-ppb moisture intrusion is shown in Figure 6, along with a line showing the parallel response of the APIMS. A clear, steep initial response appeared within 5 minutes, and the reading reached 50% of final value in 15 minutes. A digital filter with a 15-minute RC time was used on the hygrometer to smooth this amount. Since experiments with less filtering did not show improved response time, this represents the intrinsic response time of the instrument.
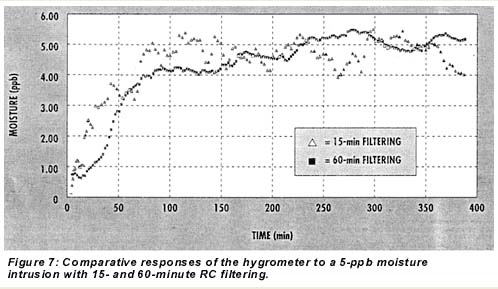
A reduction in the signal-to-noise ratio can be achieved with more digital filtering but with some sacrifice in initial and 50% response time. Figure 7 shows the hygrometer’s responses to 5-ppb intrusions with the output set for 15- and 60-minute RC time filtering. The 60-minute filtering produced much less scatter. In an operational setting, the instrument’s band levels would be set as low as 10 to 12 ppb, however, so that intrusions of 10 ppb or more would break through the UBL and stop the cycling, setting off a cycle time-out alarm, which would serve as an extra early warning system. Thus, the smoother signal availabl
Study data show that an advanced coulometric hygrometer design incorporating a counterflow sensor cell, a moisture addition feature, and signal integration extends the range of the measurement technique to single-digit ppb levels. Characterization of the hygrometer in integration mode in parallel with an APIMS indicated that its accuracy is ±4 ppb, its detection limit is 1 ppb at a 95% confidence limit, and its response time to a 5-ppb moisture intrusion is 50% in 15 minutes.
- Dance DL, Markle RJ, and Burghard RW, “Estimating the Costs of Contamination,” in Microcontamination 92 Conference Proceedings, Santa Monica, CA, Canon Communications, pp 143-152, 1992.
- Mehrhoff TK, “Comparison of Continuous Moisture Monitors in the Range of 1 to 15 ppm” Review of Scientific Instru-mentation, 56(10):1930,1985.
- Mermoud F, Brandt MD, and Weinstein BL, “Recalibration of Capacitive-Type Moisture Sensors,” Solid State Technology, 32(5):59-61, 1989.
- Smith M, and Mitchell J Jr., “Coulometric Hygrometry,” in Aquametry (part 2), 2nd ed, New York, Wiley and Sons, chap 3, 1984.
- Mettes J, Haggerty C, and Zoladz E, “Moisture Monitoring in High-Purity Gas Distribution Systems,” presented to SEMI Ultraclean Manufacturing Conference 93, Austin, TX, February 1993.
- “Guide for Determination of Method Detection Limits for Trace Metal Analysis by Plasma Spectroscopy,” SEMI Standard C 10-94, Mountain View, CA, SEMI, 1994.
Ce Ma, PhD, is a research scientist at the University of Arizona, Tucson. He received his PhD degree in physical chemistry from Indiana University in 1990. Ma is a member of IES, the American Chemical Society, and ASMS.
Farhang Shadman, PhD, is a professor of chemical engineering at the University of Arizona. He received his PhD degree in chemical engineering from the University California, Berkeley in 1972. Shadman is a member of IES, IEEE, the American Institute of Chemical Engineers, and the American Chemical Society.
Jacques Mettes, PhD, is director of new product development at MEECO, Warrington, PA. He received his PhD degree in physics from the University of Nijmegen, the Netherlands, in 1984. Mettes is a member of SEMI/Sematech and the SEMI standards gases committee. (Mettes can be reached at (800) 641-6478)
Lance Silverman, PhD, is an independent consultant specializing in chemistry, materials science, and high-purity gases. His industrial experience includes new product R&D and business development positions at Engelhard, Ametek, and MEECO. Silverman received his PhD in chemistry from Polytechnic University and did postdoctoral research at Columbia University. He is the author of 17 technical papers and patents. (Silverman can be reached at (215) 862-3126)
Reprinted from Micro, April 1995
© 1995 Canon Communications, Inc.
