
By: Jacques Mettes and Armando Velasquez, MEECO
Prof. Alan Bandy and Nucleus XU, Drexel University
Third International Symposium on Humidity & Moisture, 1998
ABSTRACT
A method is presented that permits hygrometry with established electrolytic cell technology to achieve single-digit parts-per-billion (ppb) levels. This technology is based on Faraday’s law and considered an absolute method, which is a significant advantage, especially when measuring low concentrations. The response of the system was compared to that of an Atmospheric Pressure Ionization Mass Spectrometer (APIMS). Hereto, traceable ppb level moisture challenges in the range from 5 to 25 ppb were created. An accuracy of ±3 ppb and a detection limit of 0.5 ppb were found for the tested instrument, based on a 95% confidence limit. A response time of 15 minutes was required to reach 80% offinal value for low level intrusions.
KEYWORDS: Electrolytic, Low-level, Parts-per-billion.
1. INTRODUCTION
Single digit parts-per-billion moisture analysis is done routinely on gases used in semiconductor manufacturing where the process yield is critically linked to the gas quality [1]. Trace-moisture measurements can be performed with hygrometers that are based on capacitive, piezoelectric, chilled-mirror, or coulometric (electrolytic) sensors [2]. But, because they are relative techniques, capacitive and piezoelectric sensors are of limited value at low-ppb levels, where calibration using “zero” and span gases is problematic [3].
In contrast, the coulometric method, invented by Keidel [4], is an absolute technique [5], that relies solely on physical principles and does not require calibration against moisture standards. Faraday’s law provides a relationship between a moisture concentration, the size of an electrical current and that of a gas flow. Knowledge of these last two, both easy to measure and calibrate, determines the moisture concentration.
A recently introduced generation of electrolytic hygrometers applies flow modulation to compensate for background currents that prevent the technique from reaching lower detection limits [6]. Also, by applying controlled moisture additions, the hygrometers address a problematic potential loss of responsiveness in electrolytic cells when exposed to dry gas for a long time [6].
Recognized in the semiconductor industry as a high performance laboratory instrument, Atmospheric Pressure Ionization Mass Spectrometry (APMS) is often used as a benchmark in evaluating equipment. Prof. Alan Bandy conducted the present work at Drexel University, showing electrolytic cell and APMS response to a series of calibrated moisture challenges in the range from 10 to 20 part-per-billion by volume (ppbv).
2. THEORETICAL DISCUSSION
2.1 Principle of Operation
A flow of sample gas passes through a tubular element. Moisture molecules present in this flow are absorbed by a thin phosphoric anhydride (P2O5) film that coats the inner wall containing two embedded, double helix shaped, electrodes [4]. A voltage is supplied to the electrodes and moisture absorbed by the film is electrolyzed into hydrogen and oxygen. For every water molecule electrolyzed, two electrons flow through the electrical circuit. This, together with the well-known charge of an electron, allows one to calculate the rate at which water molecules are electrolyzed from the size of the electrolysis current.
The system moves to a state of equilibrium where the rate at which water molecules enter the element matches the rate at which water molecules are electrolyzed. If, for example, more moisture enters than is electrolyzed, the excess moisture will result in a wetter, more conductive, film. This will consequently lead to an increase in electrolysis current until equilibrium is reached. In this state of equilibrium, measuring the electrolysis current provides knowledge of the rate at which moisture molecules enter the element. To report the actual concentration of moisture, however, additional knowledge is needed regarding the flowrate of the matrix gas through the element. The ratio of the rate at which moisture molecules enter and that of matrix gas molecules determines the moisture concentration.
2.2 Flow Modulation
The electrolysis current will, on the one hand, contain a component proportional to the rate of moisture entering with the gas flow. Here the proportionality factor is determined by Faraday’s law. On the other hand, noticeable only at very low moisture concentrations, the electrolysis current includes a small flow independent background current. To measure concentrations below this background level, flow modulation can distinguish the incoming moisture from the background. In its simplest form, the size of the flowrate of sample gas through the element is periodicay changed from, e.g., full size to half-size. Part of the electrolysis current fluctuates with the same periodicity as, and in phase with, the modulation. This part forms the desired signal. In practice, a more complex scenario is followed, as described below.
2.3 Moisture Addition
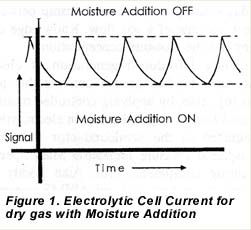
A recent innovation in the operation of electrolytic hygrometers is the periodic injection of controlled quantities of moisture. This prevents the electrolyte from drying out and avoids corresponding loss in response time. Dried out cells can be revived by exposure to sufficient moisture, while applications that monitor very dry gases on a permanent basis call for regular, automated moisture additions. These pulses not only prevent dry out, but also offer, with each moisture addition, an opportunity to observe the speed of response of the analyzer.
|
The additions are conducted on a simple on/off basis controlled by the hygrometer signal. The control algorithm adds moisture when the hygrometer reading is below a band, see figure 1, and stops the additions when the readings are above the band. This creates a cyclic pattern in the hygrometer’s response signal, consisting of a rising and a downward slope. The advantages are dual; for one, the electrolytic cell stays wet within the band. For another, the steepness and the consistency of the rising slopes can be used to monitor the responsiveness of the instrument on-line. This can be achieved by issuing an alarm when the wetting part of the cycle exceeds a certain maximum allowable time. |
2.4 Combining Flow Modulation and Moisture Addition
A scheme is described that allows one to perform moisture addition and flow modulation simultaneously, thus providing a low detection limit, as well as an on-line responsiveness check and dry out prevention.
The modulation takes place in the drydown part of the cycle. Cycles are alternately dried down, with a 100 cc/minute flow through the element and with a 50 cc/minute flow. Data is gathered regarding the total electric charge displaced during these drydown periods, where the corresponding amounts of moisture are called respectively A100 and A50. Also obtained is the duration of the drydown periods called respectively T100 and T50. A100 originates from the electrolysis of the basic quantity BQ of moisture necessary to bring the electrolytic cell from the lower limit of the band to the upper limit, plus the amount of moisture that comes in with the 100 cc/minute sample flow with a moisture concentration C during T100. A50 originates from the electrolysis of the same basic quantity BQ plus the amount of moisture that comes in with 50 cc/minute sample flow during T50. This leads to the following two linear equations that can be solved for C and BQ.
| A100 = C·T100 + BQ | (1) | |
| A50 = 1/2 C·T50 + BQ | (2) |
Note that this scheme still applies Faraday’s law to determine the quantity of moisture in the sample gas and does not require that the cell comes to an equilibrium with the moisture concentration in the sample. This is a significant advantage in terms of speed of response when measuring low moisture levels.
2.5 Automated Moisture Addition Band Setting
The above procedure not only provides a value for the concentration C, but also for the error in C. This error is based on the error in A100, T100, A50 and T50 using a standard propagation of error calculation. An algorithm slightly varies the band position from cycle to cycle, moving it to an optimal position in terms of cycle time and size of the error in C.
3. INSTRUMENT DESCRIPTION
3.1 Flow Schematic
As an inexaustible moisture source, atmospheric moisture is used as the source of moisture for the additions. Figure 2 shows the flow schematics of the instrument. Before the incoming gas enters a pressure regulator, a small stream of gas is split off to flow through a piece of plastic tubing. Atmospheric moisture permeates through the wall of this tubing and is added to the gas stream, which is then either merged back into the main flow downstream of the pressure regulator (the moisture addition “on” position), or discarded (the moisture addition “off” position).
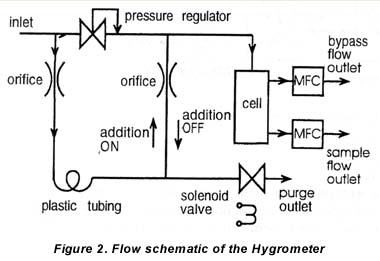
The direction of the flow in the tubing that connects to the main stream downstream of the regulator is opposite in the two positions, where it will consist of, unwetted, main stream gas that merges with the wetted stream in the moisture “off’ situation. The moisture addition is controlled by opening or closing a solenoid valve that allows or blocks the discard of gas. Various flow restricting orifices and check valves control the size of the flows and prevent moisture from reaching the cell in the absence of any flow, i.e. when shipping the instrument.
After the moisture addition, the mainstream of gas enters the housing of the electrolytic cell where part of the flow passes through the cell itself, hereinafter called the sample flow. The remainder of the flow is split off at the element’s entrance to form the so-called bypass flow, which is designed to create a large throughput of gas through the instrument. Both sample and bypass flow are controlled by mass flow controllers, positioned downstream of the sensor housing, whereafter they exit the instrument.
The fact that moisture is blended into the gas flow to the cell by an active flow leads to short wetting times and also faster cycle times compared to previous scenarios [6]. This results in a faster speed of response as well as better accuracy and a lower detection limit.
3.2 Counterflow Cell
The geometry of the electrolytic cell housing is such that the bypass flow and the sample flow exiting the sensor element are directed to flow toward the source of potential contamination. Such contamination could originate from the soft material that makes the compression-type, metal-to-glass connection or from unavoidable “dead” volume cavities connecting the electrodes. But, for such contamination to contribute to the measurement, it must counter these flows, which at atmospheric pressure provide a very high rate of inter-molecular collisions. In the case of a “sticky” molecule like moisture, collisions with the wall, dried by the shield gas, will further reduce its potential for back diffusion.
4. EXPERIMENTAL SETUP
4.1 Equipment
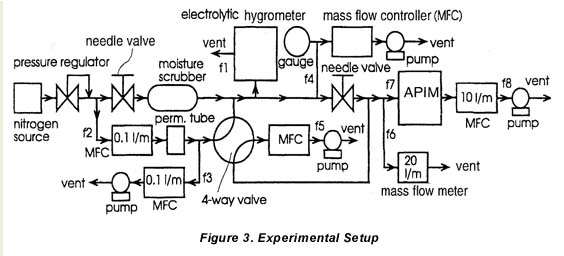
A MEECO Tracer with software version 2.12 was used as electrolytic hygrometer. The moisture level was monitored with a Model ATT0 SPEC 1 Extrel atmospheric pressure ionization mass spectrometer (APIMS), using a corona discharge ionization source. Figure 3 shows the manifold system used in the measurements. The critical part of the manifold was constructed from 0.25 inch electropolished, stainless-steel tubing and VCR fittings. Liquid nitrogen boil-off having a moisture level of about 20 ppbv was used as a source of dry nitrogen. The nitrogen was further dried to approximately 3 ppbv using an Aeronex GateKeeper Model 500K scrubber.
4.2 Moisture Generation and Traceability
The flow rates f1, to f8 indicated in 2 were measured with either mass flow controllers or mass flow meters calibrated with a Model DC-2M flow calibrator manufactured by BIOS International Corp. (traceable to NIST). Two water permeation tubes, supplied by VICI Metronics Inc., were used in the experiments. The masses of these tubes were monitored as a function of time with a Model AP290D OHAUS Inc. electronic balance having an accuracy of ±10-5 grams. The permeation tubes were maintained at 41.OºC, and the permeation rates were 218 ng/min and 240 ng/min with a 5 percent error.
The rate at which H20 vapor is added to the manifold was controlled by regulating the fraction of the H20 emitted by the permeation tube that is introduced into the manifold. This fraction was adjusted by regulating f3.
The manifold was dried by purging it with dry N2 for two days. A flow rate of about 13 L/min was maintained in the manifold during the runs. The manifold pressure was maintained at approximately 30 psi in between the two needle valves used in the setup, while the manifold temperature was maintained at 150ºC, except for the section of tubing leading into the electrolytic hygrometer.
4.3 APIMS Calibration and Determination of the Dry Nitrogen Moisture Level
Different concentrations of moisture were added to the dry nitrogen stream to calibrate the APIMS and determine the “background” level in the dry nitrogen. A plot of the APIMS response in counts per second (cts), as a function of added moisture in parts per billion by volume (ppbv), is shown in figure 4. Visually the plot was linear, which was confirmed by regression methods. Using linear regression we found the slope and standard error of the slope were 3.07 x 10⁴ cts/ppbv and 1300 cts/ppbv respectively. The intercept and standard deviation of the intercept were 1.1 x 10⁵ and 1.6 x 10² cts. The correlation coefficient (R2) was 0.97.
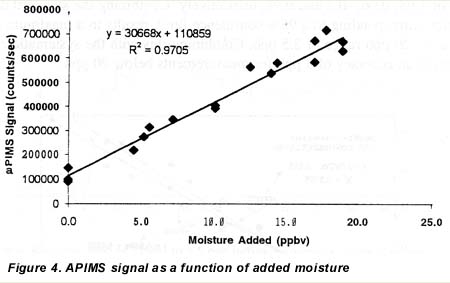
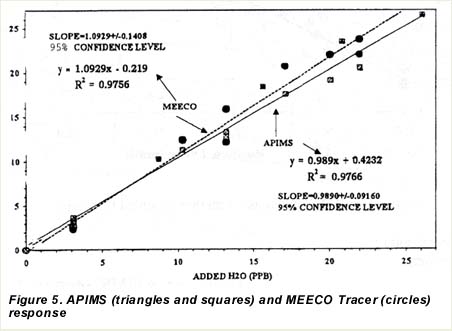
Using the APIMS sensitivity, we converted the count rates, obtained when no H20 was added, to a background H20 level in ppbv. This background H20 vapor level in the dry N2 stream after the purifier averaged 3.1 ppbv. We used this data to develop the plot of moisture levels obtained from APIMS as a function of moisture levels shown in figure 5. The ordinate of figure 5 was obtained by dividing the APIMS count rate by the sensitivity (the slope of the curve in 2). The total H2O vapor level, shown as the abscissa of 2, was obtained by adding the 3.1 ppbv background H20 vapor level to that added from the permeation tube system. Data from both permeation tubes were included in this analysis.
5. RESULTS
5.1 Accuracy
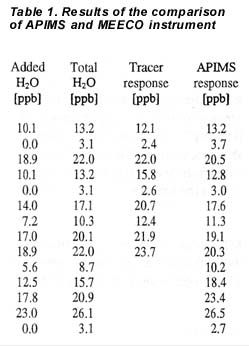
| The accuracy of the MEECO Tracer response to water was investigated over the range 10 to 20 ppbv. The results are shown in table 1, together with the APIMS response. The reported Tracer values were taken after about one hour of equilibration at an introduced level. The response of the MEECO Tracer instrument to water vapor also is shown in 2. The MEECO instrument response was linear, having a slope, standard error of the slope, intercept and correlation coefficient (R2) of 1.09, 0.06, -0.2 and 0.98, respectively. Combining the standard deviation of the slope with a factor corresponding to a 95% confidence limit, results in a maximum statistical error encountered on a 0 – 20 ppb range of 2.5 ppb. Combining this with the systematic error caused by the 1.09 slope, gives an accuracy of 3 ppb for measurements below 20 ppb. |
|
5.2 Response Time
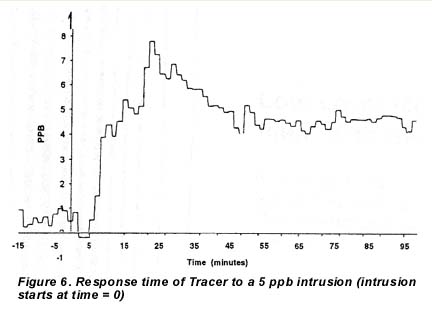
The response time of the instrument was determined by measuring the time from the start of the intrusion to 80% of final value. Figure 6 shows a 15 minute response time to a 5 ppb intrusion. A 20 ppb intrusion took 30 minutes because it caused a “breakthrough” of the moisture addition band, whereafter the automated band position algorithm had to reposition. This illustrates the advantage in terms of speed of response when measuring low moisture levels that do not require the cell to come to an equilibrium with the moisture concentration in the sample
5.3 Detection Limit
The detection limit is determined using a variation of the SEMI method for plasma spectroscopy [7]. Based on the above data on the slope, the intercept with their standard deviations, a detection limit of 1 ppb was obtained with a 99% confidence limit and 0.5 ppb with a 95% confidence limit.
6. CONCLUSION
Overall the APIMS and MEECO instrument track each other well. Low level measurements with the instrument under test showed an accuracy of 3 ppb with a 95% confidence limit. A 15 minute response time to detect 80% of a low level intrusion was found. Longer response times can be expected for higher level intrusions, where it should be noted that the low level response is critical in most applications. The detection limit was found to be 0.5 ppb based on a 95% confidence limit.
REFERENCES
- Dance DL, Markle RJ, and Burghard RW, “Estimating the Costs of Contamination,” in Microcontamination 92 Conference Proceedings, Santa Monica, CA Canon Communications, pp 143 – 152, 1992.
- Mehrhoff TK, “Comparison of Continuous Moisture Monitors in the Range of 1 to 15 ppm,” Review of Scientific Instrumentation, 56 (10): 1930, 1985.
- Mermoud F, Brandt MD, and Weinstein BL, “Recalibration of Capacitive-Type Moisture Sensors,” Solid State Technology, 32 (5): 59-61, 1989.
- Smith M, and Mitchell J Jr., “Coulometric Hygrometry,” in Aquametty (part 2), 2nd ed, New York, Wiley and Sons, chap 3, 1984.
- Hulanicki A, “Absolute Methods in Analytical Chemistry,” Pure & Appl. Chem., Vol. 67, No. 11, pp. 1905-1911, 1995.
- Ma C, Shadman F, Mettes J, Silverman L, Evaluating the trace-moisture measurement capability of coulemetric hygrometry,” Micro 1995, Canon Communications, Inc.
- “Guide for Determination of Method Detection Limits for Trace Metal Analysis by Plasma Spectroscopy,” SEMI Standard C 10-94, Mountain View, CA, SEMI, 1994.
Dr. Jacques Mettes and Armando Velasquez can be reached at
MEECO Inc.
250 Titus Avenue
Warrington, PA 18976-2426
Tel. (215) 343-6600
Prof. Alan Bandy and Nucleus Xu can be reached at
Drexel University
Chemistry Department
Staton Hall
32 Chestnut street
Philadelphia, PA 19104
